Hotshot Charts
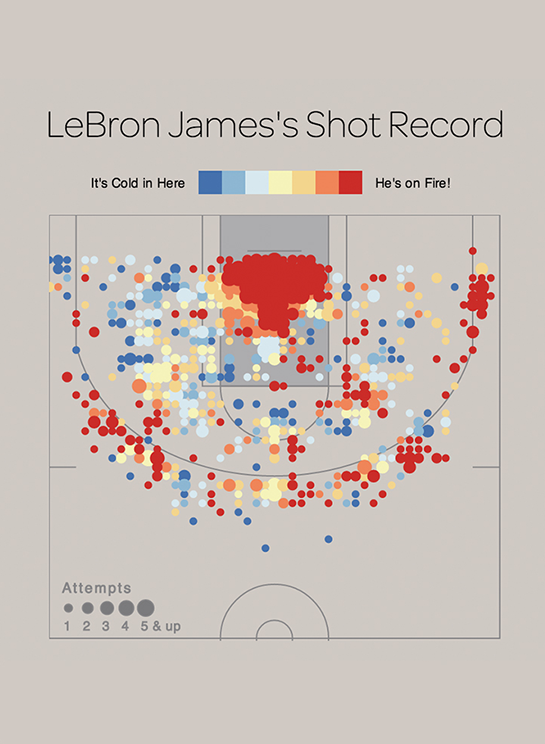
Interactive data visualizations for basketball. Pick a year, team, and player to see how teammates pass amongst themselves and where a player takes his best shots. It's that simple.

Inspired by Kirk Goldsberry's basketball shot maps. I designed the website and developed the front end application using Bootstrap, and d3.js.

Originally created with Josh Patterson and Brad Ruderman. This project is now maintained by Accenture Technology Labs.
